Historical data is important to understand the character and natural variability of water resources, so that both societal and environmental concerns can be planned accordingly. From long time-series of historical data we can identify normal conditions and detect trends towards new states, identify extreme values and the risk to be exposed to these, and evaluate the model performance against observations.
The HYPE model provides at least 30 years of water-related data in each geographical domain, also for areas and periods without measurements. The time-periods may differ but often starts in 1970’s or 1980’s. The calculations are made on a daily time step and modelled data is given for a number of variables (such as river flow, soil moisture, groundwater fluctuations, water temperature, and nutrient concentrations). The spatial resolution is given by landscape delineation into catchments, for which HYPE data represents average conditions or the outlets.
The historical data differ between the geographical domains, regarding time period, variables and resolution (i.e. catchment size) as these models were set-up with different purposes. Please, read the info button carefully in each of the applications below (top-right corner in the application)!
Here you can see long-term means and download time-series at specific sites:
Historical Long-Term Means
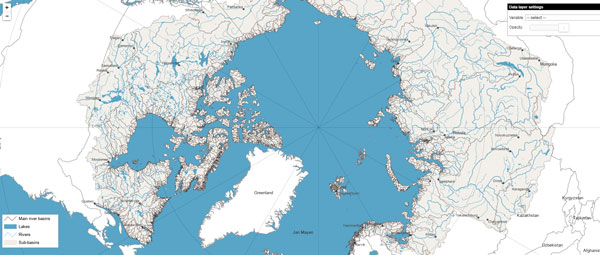
Long-term means for 30-year periods are given to show the normal water balance without annual fluctuations or influence of specific weather events. Hydrological results from HYPE are accompanied with modelled meteorological data, such as precipitation, temperature and evapotranspiration. For each domain we provide maps to give an overview of the spatial pattern for the most important variables or flow signatures in that specific region. For instance, dry regions can be separated from wet regions.
Explore spatial variability of average conditions by selecting variables in the menu of the interactive maps below!

Historical time series
Time-series are given to show the temporal variability of river flow at a specific site. HYPE provides daily or monthly values of river flow for at least 30 years of continuous calculations, which can be downloaded as Excel files for single catchments. Each year can be visualized in a graph to show the seasonal changes in flow and the variability between years. In this way, dry years can be separated from wet years and starting date of seasonal floods or droughts can be identified.
Explore temporal variability of flow in graphs and download time-series by clicking a catchment in the interactive maps below!

